Geo Web Applications with Flask
This tutorial covers building a simple web application with the Flask <> micro web framework.
Flask is a microframework for Python based on Werkzeug, Jinja 2 and good intentions.
With Flask we will build a simple Web Map Server (WMS) to serve a map created in previous tutorials.
Prerequisites
The Layers and Workspaces tutorial must be completed before proceeding as the data set up there will be used as the base of this tutorial. It is also recommended that the Styling and Rendering and Thematic Styling tutorials be completed as well.
Creating a simple WMS
Create a file named wms.py and create the skeleton for a Flask application:
from flask import *

app = Flask(__name__)

@app.route("/")
def wms():
  pass

if __name__ == "__main__":
  app.run(debug=True)
Before the app function create a new PostGIS workspace pointing at the “denver” database. And build a map out of the “city_boundary”, “neighbourhood”, and “highway” layers:
from flask import *

from geoscript.workspace import PostGIS
from geoscript.render import Map

pg = PostGIS('denver')

bndry = pg['city_boundary']
hwy = pg['highway']
hoods = pg['neighborhoods']

app = Flask(__name__)
...
Add some styling to the layers and create the Map:
bndry.style = Fill('#efebe2')

thin = Stroke('gray',1)
think = Stroke('gray',5) + Stroke('white',3).zindex(1) + Label('NAME').linear(follow=True,group=True)
hwy.style = (thin.range(min=2E5) + think.range(max=2E5)).where("TYPE = 'primary' OR TYPE = 'secondary'") + thin.range(max=5E4)

hoods.style = Stroke() + Label('NAME', 'bold Arial 12pt')

map = Map([bndry, hoods, highways])
Inside of the app function add code to parse the “WIDTH”, “HEIGHT”, “SRS”, and “PROJ” parameters from the request object, render the map, and send back the response:
@app.route("/")
def wms():
   q = request.args

   # parse width/height
   size = (int(q['WIDTH']), int(q['HEIGHT']))

   # parse srs
   prj = proj.Projection(q['SRS'])

   # parse the bounds
   bounds = geom.Bounds(*([float(x) for x in q['BBOX'].split(',')]+[prj]))

   # render the image
   img = map.render(size=size, bounds=bounds, format='png', strencode=True)

   resp = make_response(data, 200)
   resp.headers['Content-type'] = 'image/png'
   return resp
Running the WMS
Start the Flask server to start the WMS by running the wms.py script:
% jython wms.py
* Running on http://127.0.0.1:5000/
* Restarting with reloader
Create a new file wms.html with the following contents:
<!DOCTYPE html>
<html>
  <head>
    <style type="text/css">
    #map {
      width: 512px;
      height: 256px;
      border: 1px solid #ccc;
    }
    .olControlScale {
      bottom: 0em !important;
    }
    </style>
    <script src="http://openlayers.org/api/OpenLayers.js"></script>
    <script type="text/javascript">
      var map, layer;
      function init(){
         map = new OpenLayers.Map( 'map' );
         map.addLayer(new OpenLayers.Layer.WMS( "GeoScript WMS",
           "http://localhost:5000", {}, {singleTile: true}));
         map.addControl(new OpenLayers.Control.Scale());
         map.zoomToExtent(new OpenLayers.Bounds(-105.58,39.37,-104.17,40.07));
        }
    </script>
  </head>
  <body onload="init()">
    <div id="map"></div>
  </body>
</html>
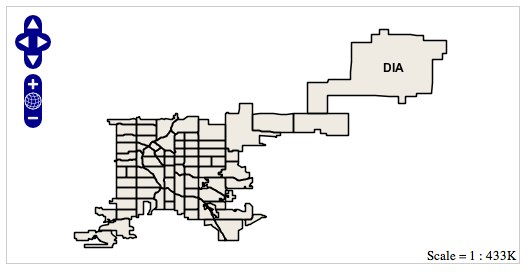
Open wms.html in a web browser.